The ReadyCMS inventory dashboard provides a complete overview of your current stock status, product availability, and inventory performance.
It helps you track overall value, monitor out-of-stock items, and identify low-stock risks at a glance.
How to get to the Inventory dashboard
- Login: Sign in to your ReadyCMS instance
- Navigate: Go to
Main menu>Inventory
- Dashboard: You can see the dashboard with a graph, stock values, a history tab, and a stock location (All, Location 1, Location 2, etc.)
Dashboard tabs
At the top of the Inventory dashboard, you'll find navigation tabs:
- Dashboard – The main real-time overview of all stock data.
- History – A log of stock changes over time (useful for audits or restocking analysis).
- All / Location filters – Switch between viewing overall stock or stock for specific store locations (e.g., "Trek & Trend Shoes").
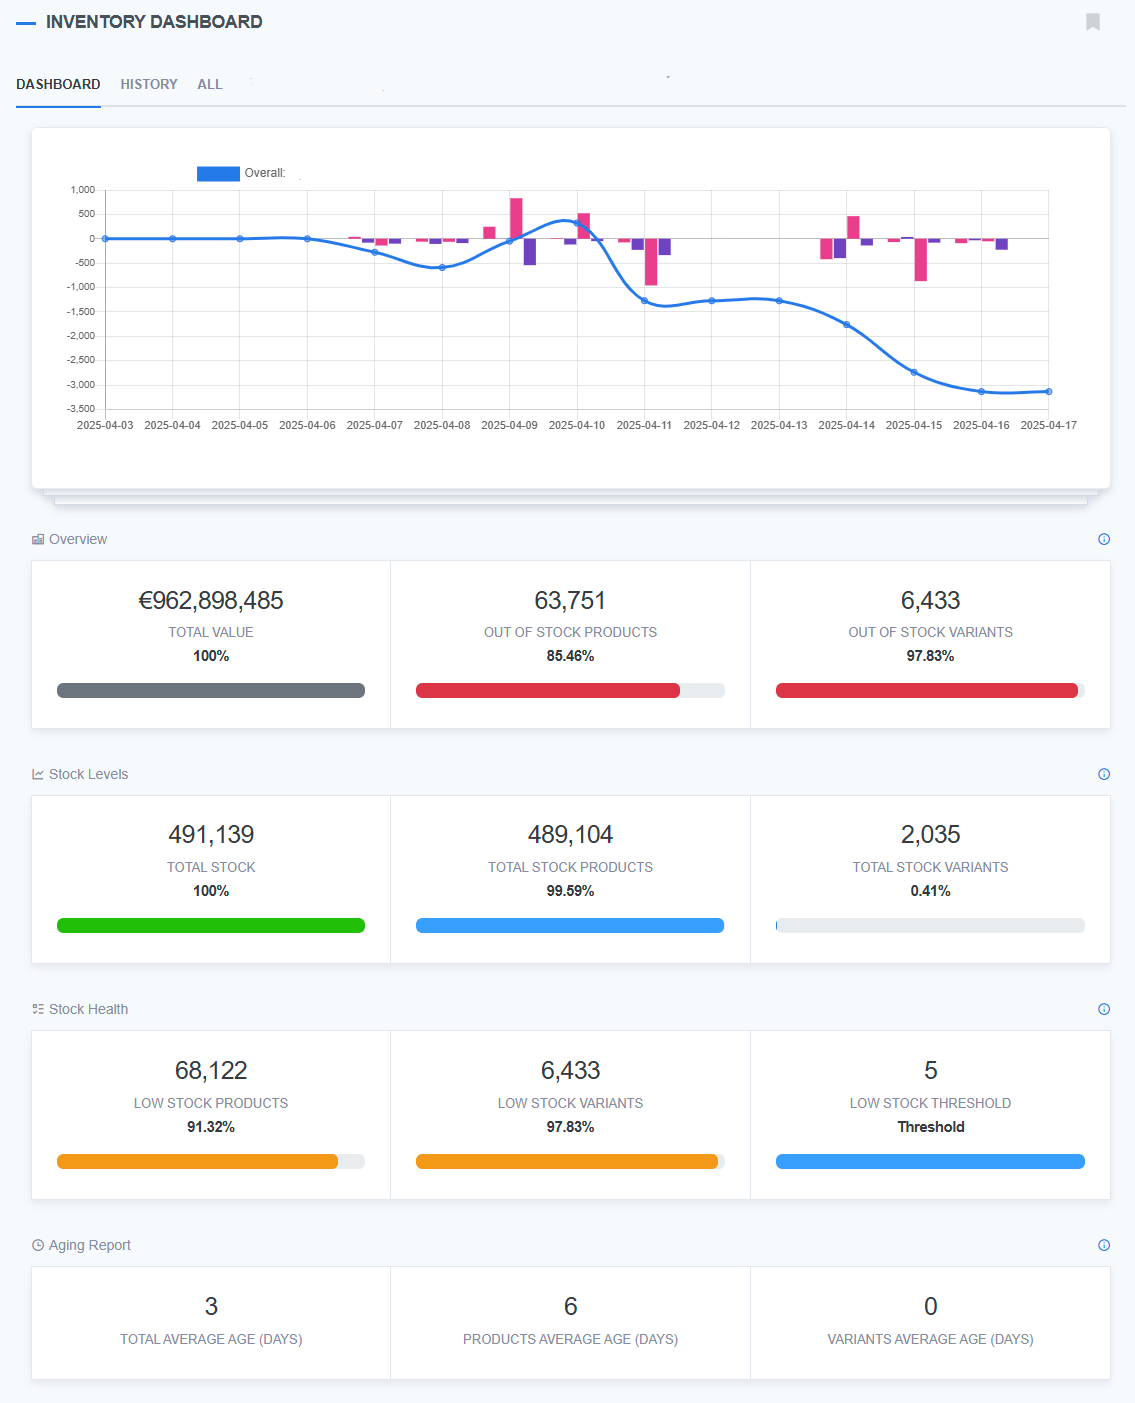
Total value (Overview section)
Use this section to assess the financial impact of your current inventory and identify immediate stockouts.
- Total value: The combined monetary value of all in-stock items, based on product prices.
- Out of stock products: Number of products with a stock level of zero.
- Out-of-stock variants: The number of product variants (such as specific sizes or colors) with no available stock.
Stock levels
This section displays the amount of inventory you're currently managing.
- Total stock: Total number of product units available across your store.
- Total stock products: Number of individual products currently tracking stock.
- Total stock variants: Number of variants being managed with stock levels (e.g., size/color combinations).
Tip: This helps you understand the scale of your tracked inventory.
Stock health
The Stock health section focuses on risk management, highlighting products and variants that are expected to run out soon.
- Low stock products: Number of products with quantity below your set low stock threshold.
- Low stock variants: Number of variants with low stock.
- Low stock threshold: The system-wide or product-specific threshold used to determine when something is considered "low stock" (e.g., 5 units).
Tip: This section helps you prioritize what to restock before items go out of stock.
Backorder-enabled inventory
The inventory dashboard now has a new Backorder-enabled inventory section that displays the number of backorder-enabled products and variants. This is added to account for out-of-stock orders.
ReadyCMS provides a feature called Allow out-of-stock orders (AOOSO). The products with AOOSO enabled are not held in stock; they are produced or ordered only when needed.
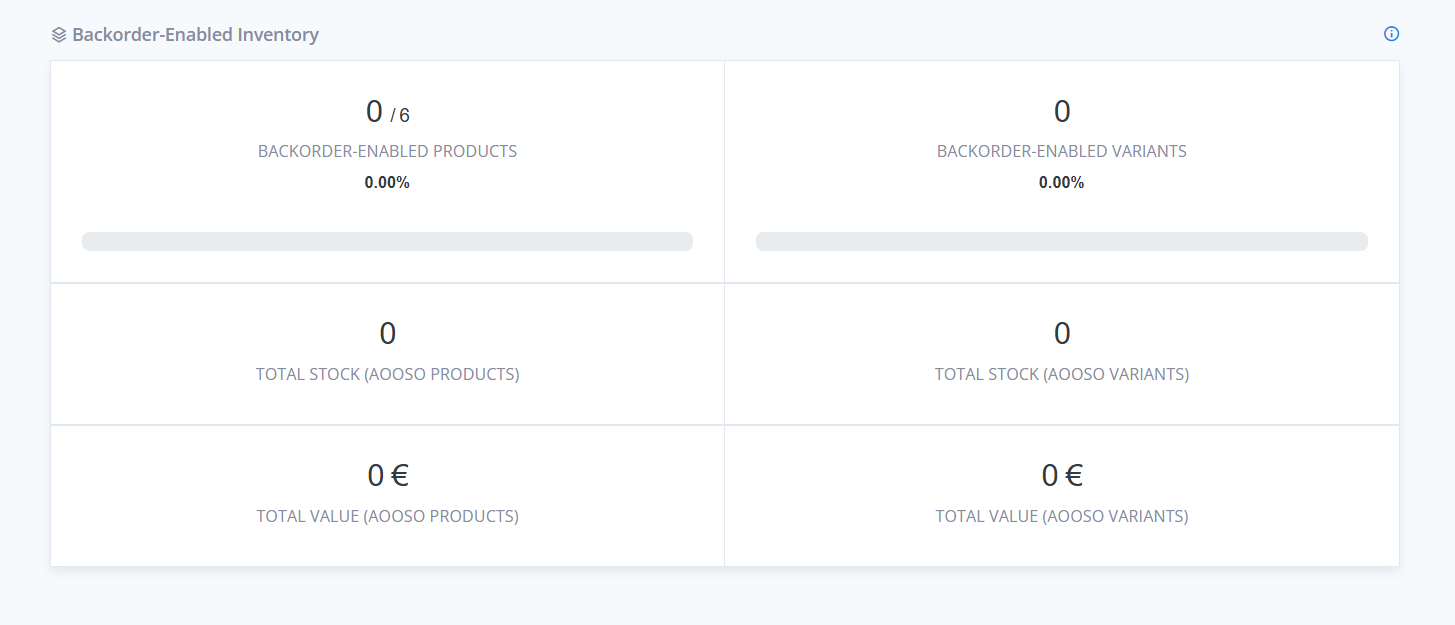
This segment also shows total stock and total value for AOOSO products (products not stored directly, but produced or ordered on demand)
The whole dashboard has been updated to properly include AOOSO data, giving you a truer picture of your stock position.
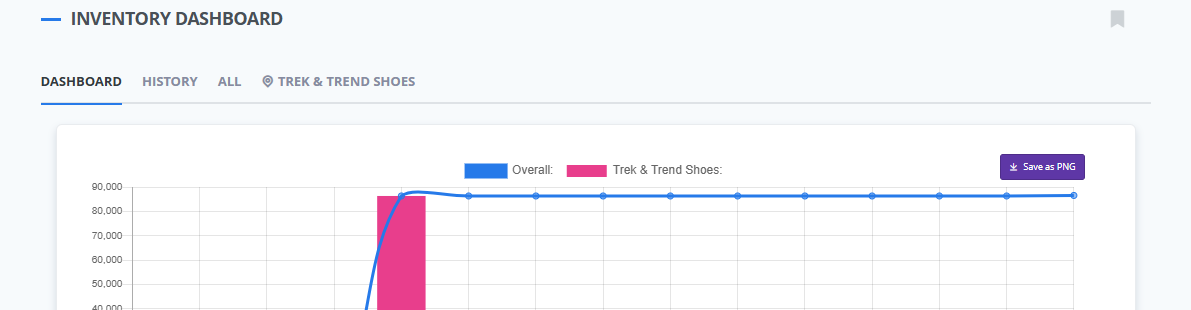
Trends (Graph overview)
The graph at the top visualizes stock trends over time:
- Track fluctuations in your total stock value.
- Compare performance across store locations.
- Spot unusual drops or spikes in inventory (e.g., bulk restocking, seasonal demand).
Tip: You can save your graph as a PNG image -
Save as PNGbutton in the top right corner of the graph.
Stock history
In the History tab, you can review a detailed log of all stock changes:
- Manual stock adjustments
- Automatic changes from orders (purchases, returns, cancellations)
- The user or system process responsible for each change
Use this for inventory audits, resolving stock discrepancies, and improving stock accuracy.
⇒ Check out stock management and stock history to learn more about those topics.
What's next?
Our next dashboard, which we would like to introduce, is the Activities dashboard.
Previous topic: eCommerce dashboard